1× · 5.2 s
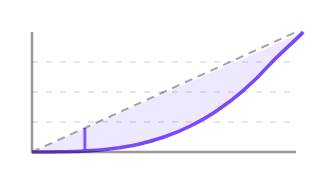
A Lorenz curve of holder concentration bows away from the dashed line of equal distribution while an accent probe walks the deciles and measures the gap between the two, standing tallest where concentration peaks.
Part of a paid plan
The preview plays here in full; the code and the files are what a plan includes. A plan also drops the credit line and opens the rest of the premium catalogue.
The Free licence asks for one visible credit per page: Animation by Pulsar, linked to Pulsar. The credit line is that link, ready to paste. The snippet itself carries attribution in a comment and in the SVG’s metadata, and never links anywhere on click. Licence
- Tier
- CSS
- Dependencies
- None
- Duration
- 5.2 s, loops
- Categories
- Data and progress
- Use cases
- Dashboards and reporting, Compliance and audit
- Industries
- Finance and fintech, Security and identity
- Style
- Data mark · light stroke
- Set
- tokenomics
- Tags
- chartlineloopminimalstroke
Companion assets
The same artwork, not animated. Derived from the entry’s own resting state, so it matches exactly.