1× · 4.6 s
Outlier Cleansing
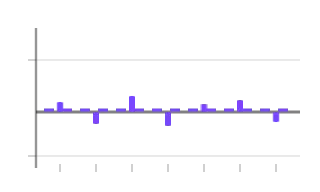
CSSA scatter of demand points sits inside a tolerance band while one flagged reading far above it is pulled back down onto the cleansed series.
Part of a paid plan
The source for this animation is not published on this page. Sign in with a plan that includes it to copy or download the files.
The Free licence asks for one visible credit per page: Animation by Pulsar, linked to Pulsar. The credit line is that link, ready to paste. The snippet itself carries attribution in a comment and in the SVG’s metadata, and never links anywhere on click. Licence
- Tier
- CSS
- Dependencies
- None
- Duration
- 4.6 s, loops
- Categories
- Data and progress
- Use cases
- Errors and warnings, Search and filtering
- Industries
- Logistics and supply chain, Manufacturing and industrial, Enterprise operations
- Style
- Data mark · light stroke
- Set
- demandplan
- Tags
- chartdotsloopminimalui
Companion assets
The same artwork, not animated. Derived from the entry’s own resting state, so it matches exactly.